Build fast and error-free Meteor apps
Understand what is happening inside your app to identify worthwhile optimizations and create a better experience for your users.
Production Monitoring
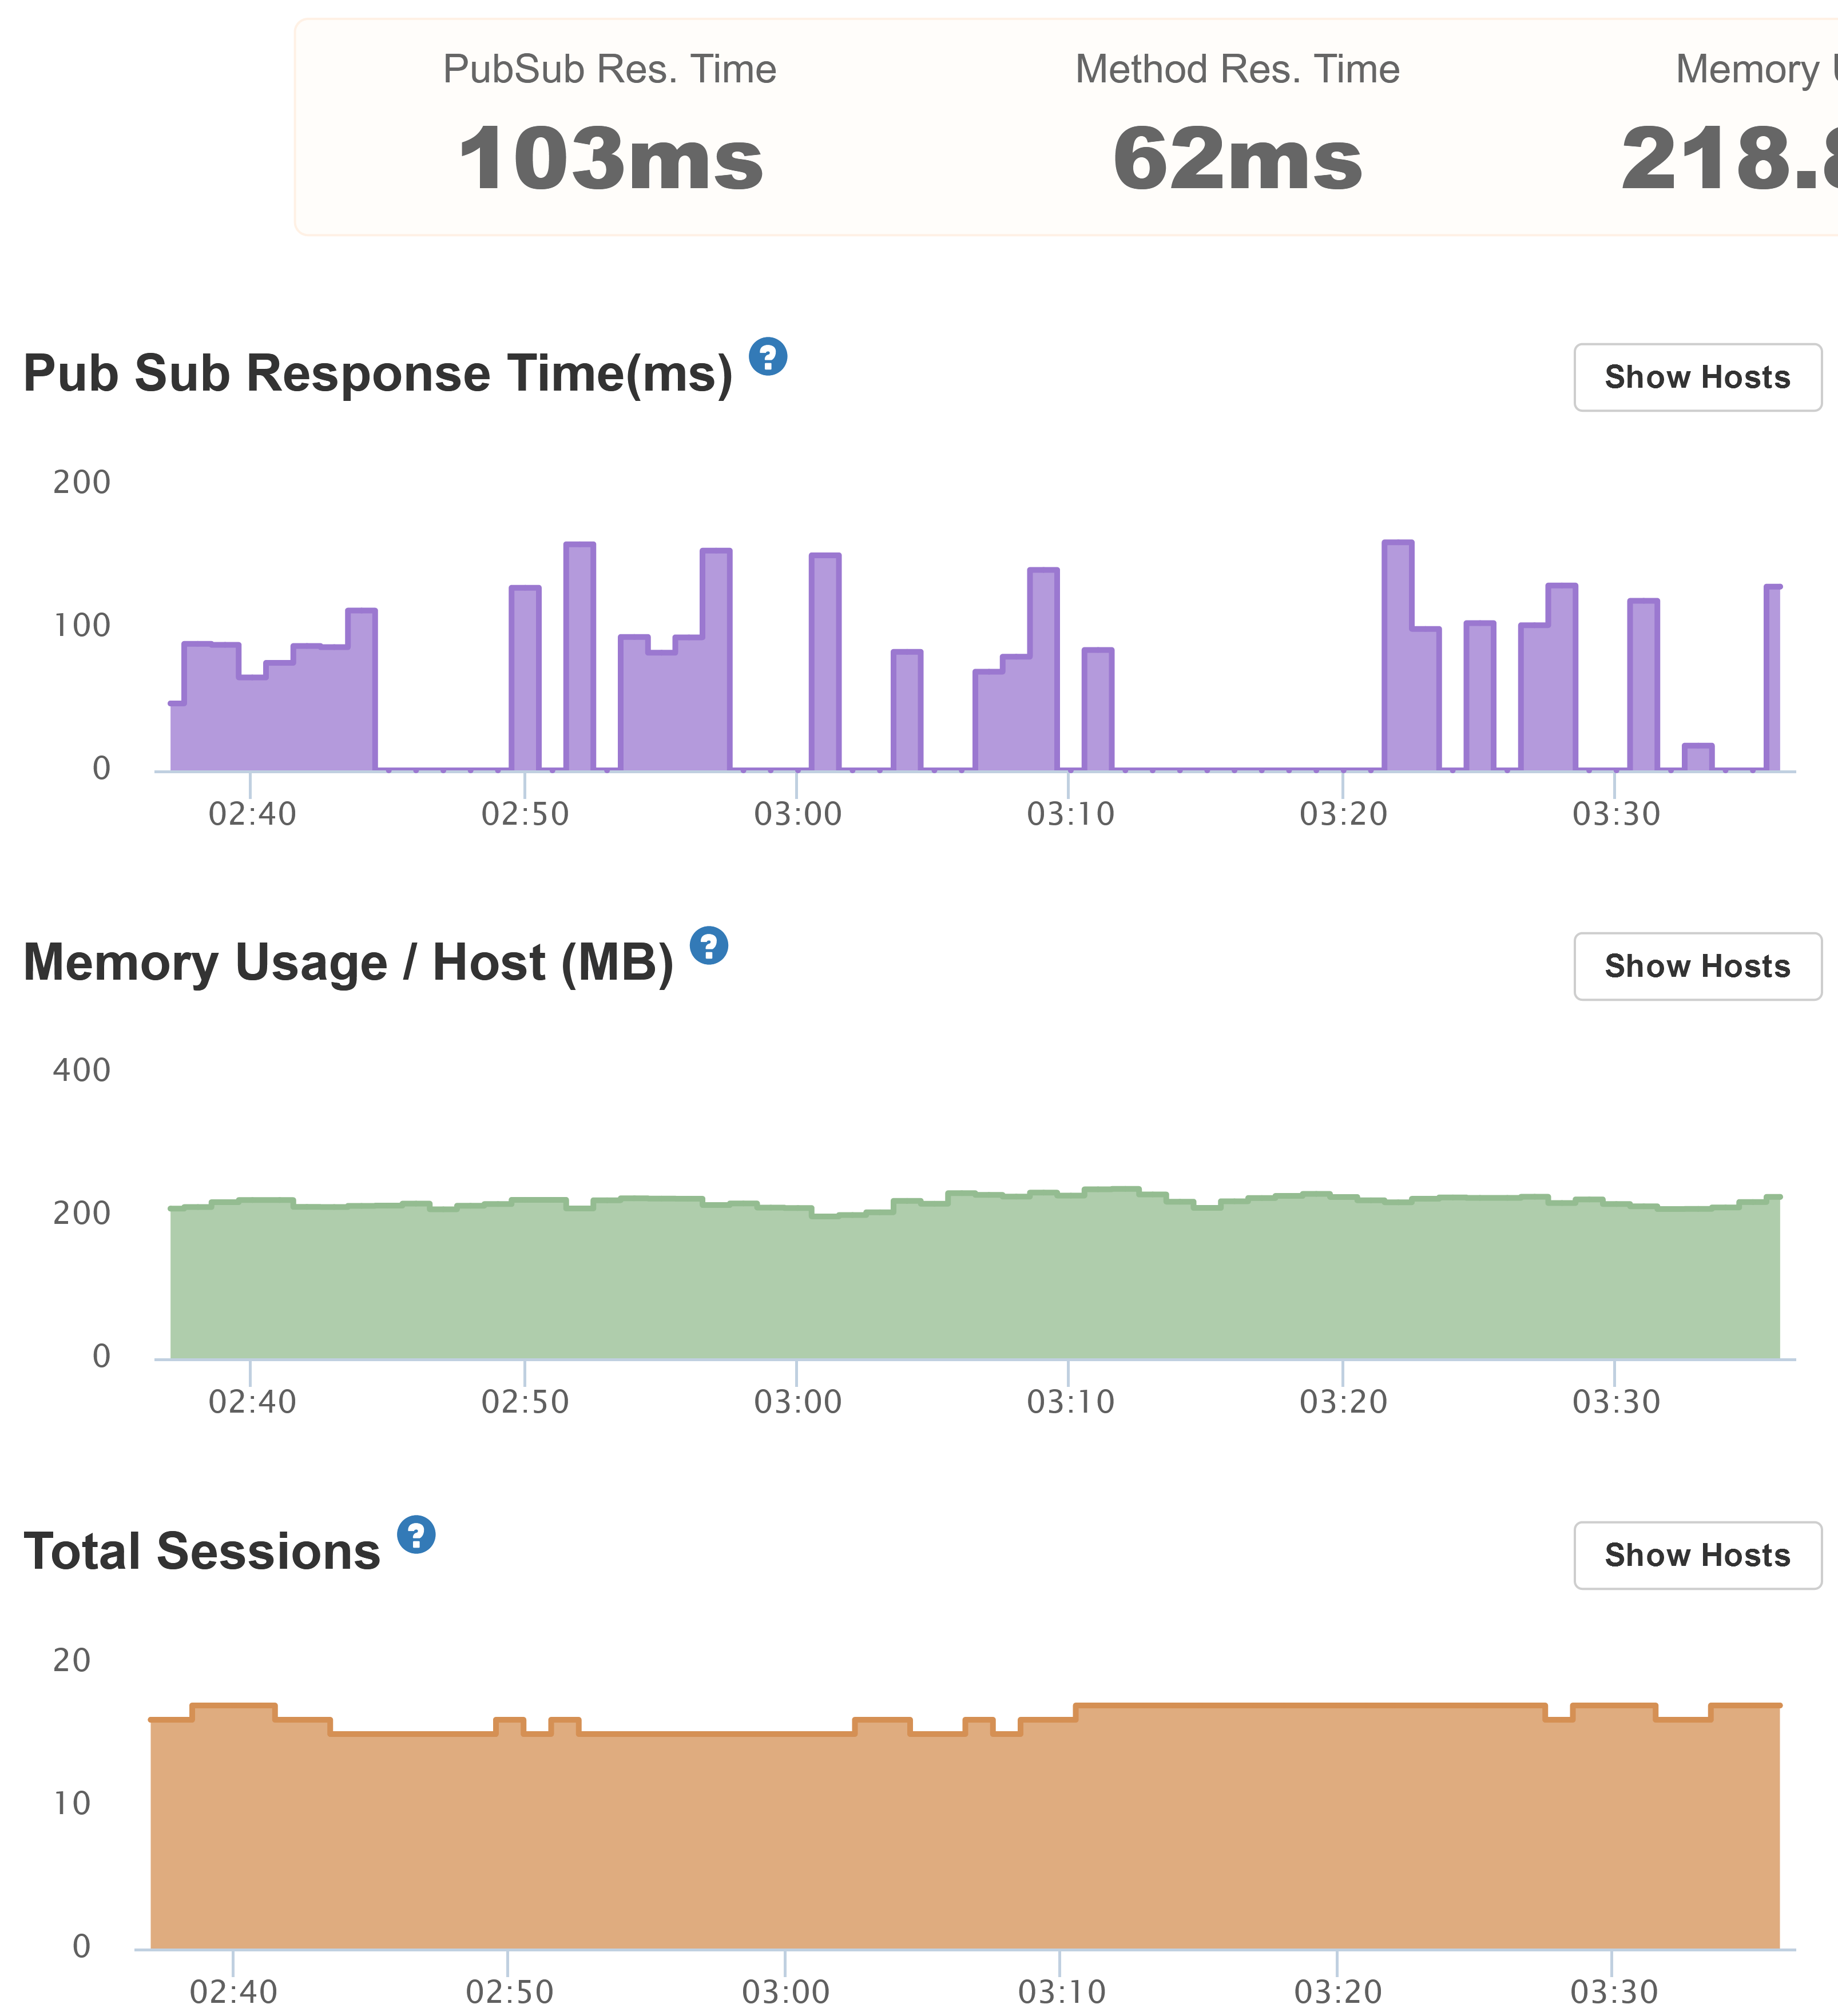
See what is happening inside your app in production to improve performance and avoid problems.
Built for Meteor
Monitor Meteor specific metrics for methods, publications, the oplog, and more that are important to the app's health.
Detailed Traces
See exactly what happens in slow methods or publish functions.
Alerts
Get notified when something is wrong, so you can fix it before it affects your users.

Error Tracking
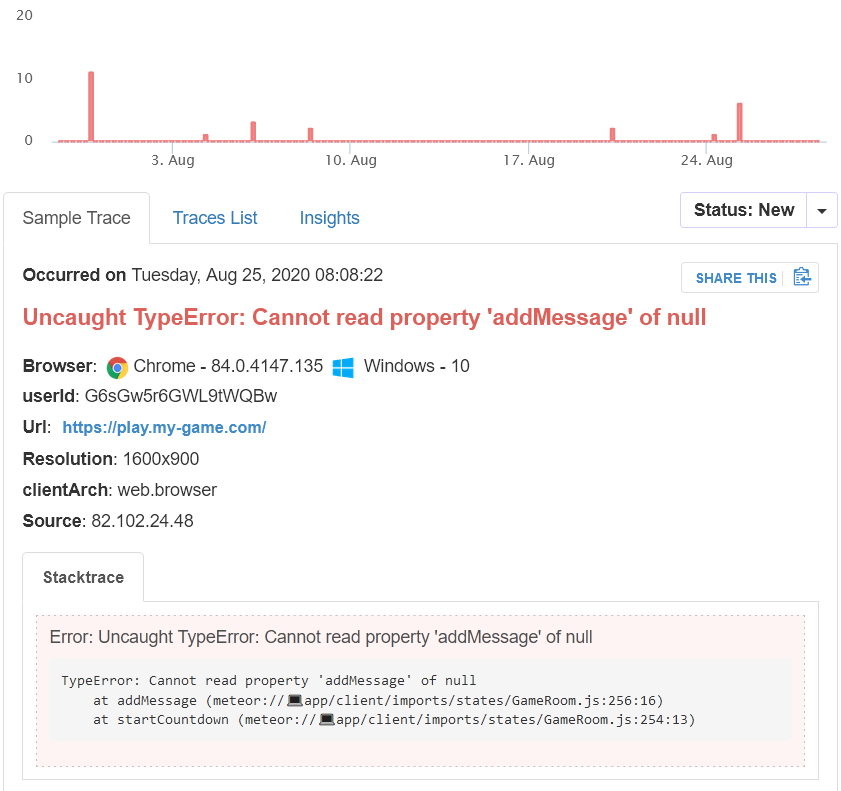
Built for Meteor to gather all of the errors affecting your users along with the information you need to fix them.
No Config Source Maps
Monti APM will automatically use source maps for apps that have them to show more helpful error traces.
Error Insights and Events
Easily reproduce errors by viewing similarities between occurrences and the events leading up to the error.
Error Status
Keep track of which errors are fixed, being fixed, or new.

Pricing
Startup
$5 host / month
7 days retention
Unlimited alerts
Unlimited collaborators
Multi-host support
Error insights and statuses
CPU profiling
Get StartedPro
$10 host / month
30 days retention
Unlimited alerts
Unlimited collaborators
Multi-host support
Error insights and statuses
CPU profiling
Get StartedFrequently Asked Questions
What is a host?
A host is a single application process in your app. Different hosting providers use different names, such as containers, servos, or dynos.
How is the host usage calculated?
We use the median hourly usage over the previous month. The median stays consistent even if the number of hosts spikes or autoscales for short periods of time.
It is calculated by getting a list of the host usage for your app over the previous 30 days and aggregating per hour. In most months this results in 720 values (24 hours * 30 days). We use the median of those values.
What is data retention
Data retention is how far back you can view historical data. For production apps you usually want at least a week.
Do all of my apps have to be on the same plan?
You are able to choose if each app is paid or free, though all of your paid apps are on the same paid plan (startup or pro).
Can I change plans?
Of course, you can change plans or cancel at any time
Have a question? Just Ask! We are happy to help you out.